Halftime!

July 7, 2024

Posted by Jason Edinger on Tue, 07/02/2024 – 11:22

FirstHalfChart

First Half Highlights

Tempus fugit. An apt Latin reminder that time is fleeting. With the first half of 2024 already in the books, the year is flying by, and equity investors have been rewarded thus far with solid gains. All but one of the major indices (microcaps) were in the black for 1H, with the NASDAQ and S&P500 leading the way, lagged by the Dow and Russell 2000.

Year-to-date, size has mattered as large- and mega-cap stocks have decidedly outperformed their smaller brethren. Given massive weightings in their respective indices, the outperformance of large vs. small this year is mostly attributed to the robust gains of several mega-cap stocks, notably Microsoft, Nvidia, et al. The 2024 reality: it is all about tech and large-cap. Nevertheless, stocks overall have edged higher this year, turning in a great first half and extending the rally that began in October of 2022*.

FirstHalfStats

The first half of 2024 was more challenging for the bond side of the ledger. Interest rates rose over the period, with the 10-year Treasury yield climbing from 3.9% in January to 4.6% by the end of May. This rising interest rate environment, which asserted itself across the entire yield curve, weighed on bond prices, keeping returns muted across most fixed income sectors. After a challenging 1H, current rate levels have set the stage for a better second half. Fixed income valuations look favorable across several sectors, with various investment-grade yields at or near their highest levels in a decade. Spreads remain tighter than historical averages, but the higher absolute yields should be supportive of more appealing fixed-income returns on a go-forward basis.

We would be remiss to discuss the bond environment without spending a few words on the Federal Reserve and inflation. The latter has proven to be stubbornly sticky this year, putting upward pressure on interest rates and, by extension, the Fed. Owing largely to better-than-expected economic data, the markets have hawkishly repriced their expectations on the interest rate front, with only one or two cuts remaining possible this year. Nevertheless, the overall trend is toward disinflation and softening economic data, which should give the central bank enough cover to either a) signal even more accommodative future monetary policy or b) simply begin cutting interest rates altogether. If either of these scenarios play out, it could spark a rally for bonds to close out the year.

Looking Ahead: Glass Half Risky?

Inflation remains front of mind for investors and economists. Although inflation continues to move in the right direction, the risk of a re-acceleration is very real, and any upward surprise in the data could cause serious disruptions in both stock and bond markets.

Investors don’t seem to care much about the narrow market breadth we are currently seeing. As mentioned above, the market rally has been driven primarily by just a handful of stocks (only 60% of S&P500 constituents are positive this year), which can be interpreted as a sign that the broad indices are poised for a correction deeper than any we have seen this year. There is the chance that mega-cap stocks have run too far too fast, and the markets spent the better part of June consolidating after one of the most bullish 5-month periods on record. They may have trouble getting re-energized for the remainder of the year.

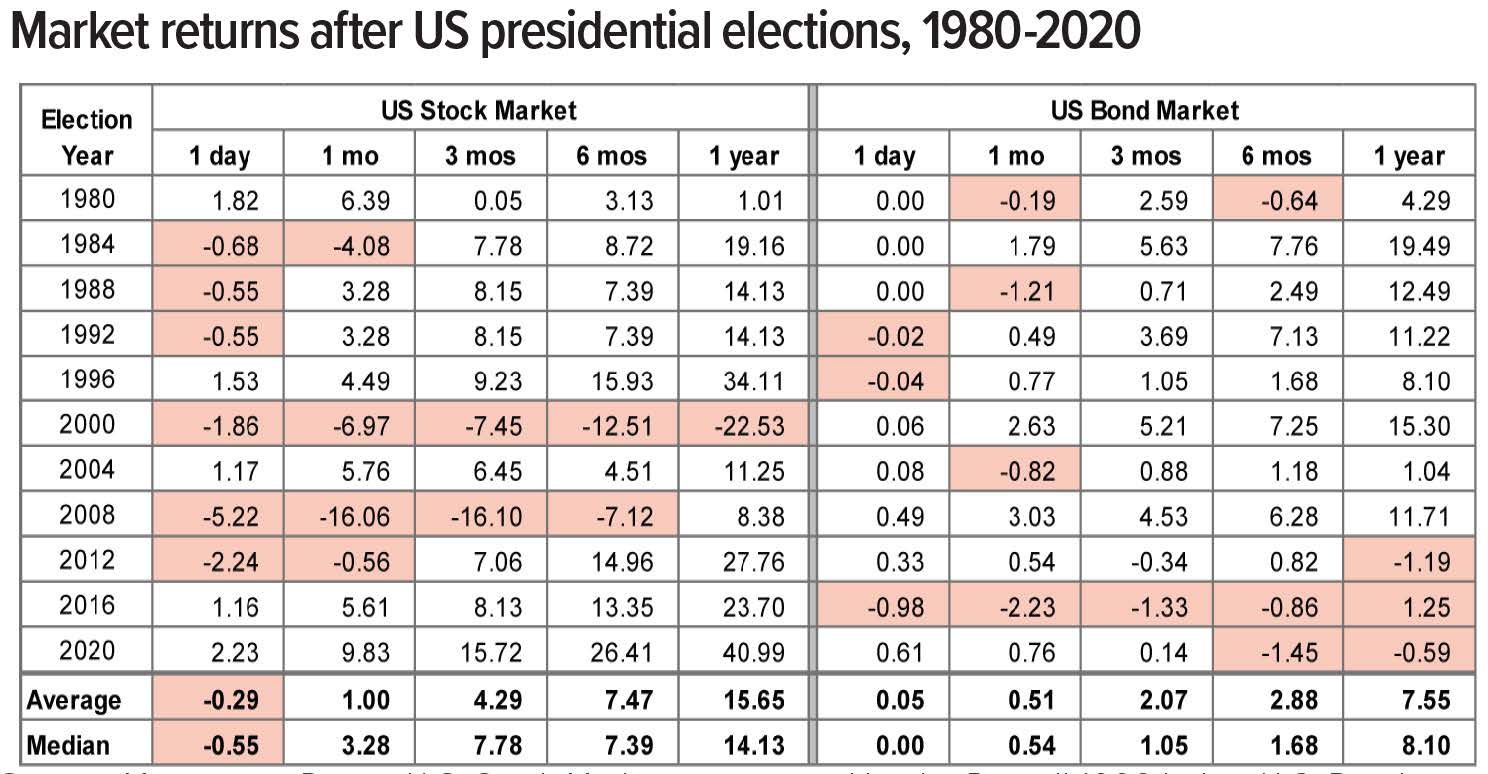
Finally, markets do not seem worried about war or politics. The ongoing war in Ukraine, continued conflicts in the Middle East, and China’s economic slowdown all have potential to cause further regional and global uncertainty that could spill over to the broader world economy in the second half of the year.  In addition, we face considerable political instability due to the U.S. elections in November. We’re likely to see this uncertainty ramp up as the political convention season kicks off this summer and we get closer to election day.

Glass 6/10ths Full

The good news is that our economy and capital markets are incredibly dynamic and resilient. We expect economic growth, while moderating somewhat, to remain broadly positive and should help the fight against inflation. Stock fundamentals are in solid shape, and total return prospects for bonds are looking as good now as they have in a very long time. Finally, we have a Federal Reserve who has made it crystal clear that its next move is a rate cut. That recipe – slowing inflation, decent growth and lower interest rates – should favor the optimists. While there are risks, we remain overall bullish on the markets as we kick off the year’s back half.

As ever, we thank you for your continued trust and support.

* chart source: NASDAQ

All indices are unmanaged, and investors cannot actually invest directly into an index. Unlike investments, indices do not incur management fees, charges, or expenses. Past performance does not guarantee future results.

Nvidia Games

June 11, 2024

Posted by Jason Edinger on Sunday, March 3, 2024

The rally rolls on. Hard. Statistically, February is a challenging month, but this go ‘round the bulls defied the odds to end squarely in the green (and in record territory). The Dow, S&P500, and NASDAQ all made fresh all-time highs, while small caps (Russell 2000) made a new 52-week high. The Magnificent 7 stocks were mixed, as several of the darling tech companies failed to achieve new highs with the market and show signs of topping out. All S&P sectors were higher on the month, led by consumer discretionary, industrials and, of course, technology. All told, February did not suffer its usual sluggishness and as a result, 2024 is off to a very solid start.

The biggest story of the month was Nvidia, the poster child for both the tech sector and, more importantly, artificial intelligence. In its most recent quarterly update, Nvidia reported mind-boggling numbers, including a 265% increase in annual revenue. CEO Jensen Huang guided to even stronger projections for 2025 and 2026, also declaring that artificial intelligence had “hit a tipping point” with surging demand “across companies, industries, and nations.” Accordingly, Nvidia was rewarded with a $277B increase in market cap that day, an historical record for any US-listed company. The stock was up 28% on the month and helped fuel the broader rally across the major indices. Investors remain spellbound by the potential of artificial intelligence, and no company has done more to capture their collective imagination than Nvidia.

The other big story in February was the hawkish shift in rate cut expectations from March to June. The messaging out of the Federal Reserve has remained remarkably consistent in recent months. The central bank remains “data dependent” and wants to see more evidence of inflation cooling before it cuts rates. It also signaled that it would begin discussions of quantitative easing at its next meeting, effectively taking a March rate cut off the table. As such, Fed fund futures are now pricing in a 67% chance of a cut in June and just three 25bp cuts this year (see chart courtesy of CME Group).

FedProbJune
 

From an economic standpoint, the data continue to come in mixed. January was the third consecutive month where the unemployment rate did not budge from its 3.7% mark, and the 24th consecutive month below 4%. The employment number was much stronger than expected, with job creation clocking in at 353K vs. 185K expected. This was the highest level of job creation in over a year. By contrast, inflationary data were less rosy, as the year-over-year headline number came in above expectations at 3.1%. As has been the case in recent months, shelter and food at home were the biggest drivers of price increases. This report, while showing year-over-year easing in inflationary pressures, was still hot enough for the Fed to maintain its hawkish timeline as to when rate cuts will begin.

A few words must be said about cryptocurrency and bitcoin. The world’s most valuable cryptocurrency ended February with an astronomical gain of 43%, its best monthly achievement in over three years. The rally was supported by the SEC’s January approval of 11 new spot bitcoin ETFs, which have garnered substantial inflows (tens of billions) and have sparked renewed enthusiasm (and speculation) in cryptocurrency. Bitcoin is now up seven months in a row, and the wave of optimism has spilled over into crypto-centric companies such as Microstrategy and Coinbase. Resembling what we are seeing in the artificial intelligence space, it is obvious that speculation is back in the cryptocurrency markets.

Looking ahead, we have Fed Chair Powell testifying in Washington on March 6th and 7th. His comments will likely impact how bond and equity investors position themselves for the near and intermediate terms. In terms of economic releases, we have the usual slate of nonfarm payrolls (8th), inflation (12th) and FOMC rate decision (20th).

As ever, we thank you for your continued trust and confidence. Please reach out with any questions or concerns.

*This article is intended strictly for educational purposes and is not a recommendation for or against cryptocurrency.

Rain Down On Me

Posted by Jason Edinger on Friday, May 3, 2024

Indisputably, the weather affects mood, and the mood amongst investors in April was gloomy and downbeat. Equities endured a tough start of quarter, with the S&P500 posting both its first monthly decline of 2024 and its first 5% pullback in 6 months. 10 of the 11 GICS sectors were in negative territory, with only utilities ending in the black. Fixed income markets also struggled, as treasury yields increased across the curve with the bellwether 10Y yield hovering at 6-month highs and poised to challenge the key 5% level. This weakness was the dual result of sticky inflation and a higher-for-longer narrative, which served to rain on rate cut expectations and put pressure on capital markets.

During the month, we saw a significant shift in market expectations regarding the probability and magnitude of interest rate cuts. Over the last several quarters, the market was confident that we would see at least 3-4 cuts this year, with interest rate futures pricing in as many as 6-7 back in January. Expectations have quickly changed, with the market now predicting just a single 0.25% cut this year, if any at all! This hawkish sentiment was fortified by nearly all Fed committee members, who affirmed that persistent inflation data have not provided the confidence needed to embark on an easing cycle. Accordingly, yields on treasury bonds rose sharply, with maturities from 2-30 years all increasing by at least 0.45% during the month. Dark and difficult times for bond investors, indeed.

Economic data took center stage in April, as both inflation and overall economic performance were key barometers. The pace of headline inflation surprised to the upside at +3.5% year-over-year, with notable price increases in sectors like shelter and services. US inflation has levelled out in the 3-4% range for the last nine months, calling into questions whether the Fed can really get price increases down to that critical 2% level. Despite strong payrolls and retail sales, Q1 GDP figures in April surprised to the downside, signaling lower growth in the economy. This combination – stubborn inflation and weaker economic growth – gave birth to a new narrative of the dreaded term “stagflation” which is commonly defined as a period of high prices and anemic growth.

Despite the morose and overcast environment, there were some glimmers of sunshine as we closed out the month. Earnings season has generally delivered the goods, exceeding expectations with higher-than-expected growth rates. Mega cap tech stocks, to include several of the darling “Magnificent 7,” reported robust earnings, underscoring that secular growth and the artificial intelligence themes are both alive and well. The economy continues to show resiliency and strength, particularly in the labor market with the unemployment and labor force participation rates trending in a positive direction.

Finally, we note that commodities were the only major asset class to enjoy gains in April. Lately we have written here about the strong performance of gold and other commodities, and that trend continued in spite of the market challenges mentioned above. Notable strength was seen in the industrial and precious metals sub-sectors, as strong demand supported prices. Gold tagged a new all-time high and continues to break out even further. All told, gold and the broader commodity complex bear watching as there is a “glass half full” attitude towards the asset class as the skies grow greyer and darker for traditional stocks and bonds. Perhaps the dawn is breaking on a new bull run for commodities.

We hope you have a wonderful month. May the skies clear and part for sunshine. The market’s mood – and our own – could use some light right about now. If we are lucky, by the next writing spring will have finally sprung. In the meantime, please reach out with any questions, and thanks as ever for your continued trust and support.

All indices are unmanaged, and investors cannot actually invest directly into an index. Unlike investments, indices do not incur management fees, charges, or expenses. Past performance does not guarantee future results.

Four Stars Out Of Five

Posted by Jason Edinger on Tuesday, June 4, 2024

May was a solid month for equity markets, rebounding from a weak April to close in the black for the fourth month out of five this year. All the major benchmark indices closed the month higher than they began it, and the S&P500, Dow Jones, and NASDAQ all clipped new all-time highs. 10 of the 11 GICS sectors were positive, with only energy declining, owing mostly to falling oil prices. The tech-heavy NASDAQ lead the way with a 7% total return, while the old-school Dow lagged, delivering 2.6% of positive performance during the month. Overall, stocks reversed the prior month’s losses and move into June boasting an 80% monthly batting average so far in 2024. Not bad in my mind’s eye.

As has been the case in recent history, technology played the starlight role in May, turning in a 10% month to bring its year-to-date performance up to 17.3%. The sector owes much of its power to semiconductors, most notably the darling AI chipmaker Nvidia. The mega-cap tech giant delivered impressive quarterly results yet again, with both top-line revenue and bottom-line profit blowing even the most ambitious estimates out of the water. The company also guided towards even higher revenue and profit projections in the coming quarters. Accordingly, NVDA broke out to fresh record highs and was the single greatest contributor to S&P500 performance during the month. The mantra holds true:  as goes tech, so goes the market.

If fundamentals drive market performance, as is often alleged, then investors have reason to remain optimistic. Q1 corporate earnings for S&P500 companies were solid, with 78% of companies beating earnings-per-share estimates. FactSet reports that the blended EPS growth rate for all members was 5.9%, far exceeding the 3.4% estimate. Communication services alone delivered an earnings growth rate of 34%. Some caution is warranted, however. Both revenue beats and EPS surprises were below long-term averages, and if one strips out the Magnificent 7 stocks, the blended growth rate for the S&P is -1.8%. Market breadth issues remain a concern, although tech and AI momentum continue to paper over the problem, at least for now.

In terms of economic releases, inflationary data were front of mind. Encouragingly, both CPI and PCE (two related but different measures of inflation) showed prices stabilizing in April, with each statistic rising just 0.3% monthly. The market quickly responded to the inflationary downtick, reigniting hopes for interest rate cuts later this year and kicking the “higher for longer” can down the road for at least one more month. While this bucking of the trend is undoubtedly a welcome development, overall inflation remains well above the Federal Reserve’s long-term 2% target rate, and during the month Jerome Powell himself suggested that the disinflation narrative would need more time to play out before the central bank can begin cutting rates.

Nonetheless, treasuries were mostly higher during the month, as a modest decline in yields resulting from the hope of disinflation contributed on the bond side as well. The bellwether 10YR treasury yield dropped during May, hovering around that critical 4.5% level from which it has not strayed much in the past 60 days. The treasury market remains in a holding pattern, awaiting the possibility of future interest rate cuts while digesting the ever-important inflation, jobs, and GDP data as they come. To note: the 10/2-year maturity curve remains inverted, as it has been for nearly 2 years now. Classically, this would be a leading indicator of a recession on the horizon, but we see no such signs as of this writing.

That seems like a fitting way to wrap up this month’s remarks. Memorial Day has come and gone, and as we near the midway point of the year, we wish each and all of you a happy early summer. Last month we found ourselves wishing for bright and sunny skies, and there is no doubt that May delivered both in spades. Let us hope this keeps up, in terms of both the weather and the markets. As ever, we thank you for your continued trust and support.

Serenity Dow

April 5, 2024

Posted by Jason Edinger on Tuesday, April 2, 2024

Coming off a robust quarter to conclude 2023, US equities rode the momentum to a series of new all-time highs in Q1, delivering the strongest start to a year since 2019. The S&P500 rose by 10.6% on a total return basis and notched twenty-two record highs during the quarter. While the rally was uniform across the board, small-caps lagged large-caps by a wide margin (Russell 2000 +5.2% vs S&P500 +10.6%) as the market digested a less dovish rate cut environment moving forward. Growth outperformed value, and ten of the eleven GICS sectors were positive during the quarter, with real estate the only sector showing red as of March 31st. To put it mildly, the sailing continues to be smooth.

In contrast to last quarter’s rally – which was a result in large part due to the dramatic fall in bond yields – the extension of gains this quarter came despite a more hawkish repricing of future monetary policy. The Federal Open Market Committee held its benchmark rate constant for the fifth consecutive month (5.25-5.5%) as it seeks more economic data to show “greater confidence” that inflation is on the path toward the magical 2% number. As of this writing, the Fed dots show a projected three cuts in 2024, potentially beginning as early as June or July. This is in stark contrast to the approximately seven cuts seen by the market to begin the new year. With gas prices moving steadily higher to $3.53 per gallon on average, March inflation will be a major influence on the Fed’s decision to begin easing policy.

In terms of economic data, we saw Q4 GDP revised up to 3.4% from its initial 2% consensus, based on a strong consumer who just refuses to stop spending. And why would they? The labor market remains incredibly resilient, with 229K jobs created in January and 275K in February. At the same time, inflation as measured by the Fed’s favorite indicator continues to sink, affirming the goldilocks scenario comprised of cooling inflation, decreasing interest rates, and broadly supportive economic conditions. Not too hot, not too cold, but just right.

Equities are not the only asset class tagging all-time highs as we move into April. Both Bitcoin and gold prices touched unfamiliar territory during the quarter, with the latter now costing more than $2,250 per ounce, up nearly 40% from its recent bottom in 2022. Given gold’s status as a safe haven asset that typically rallies during risk-off markets, this recent uptrend is slightly unusual, but the precious metal continues to increase in value as both the US Dollar and interest rates are projected to fall during the back half of this year. The fact that gold easily blasted through the psychologically crucial $2,000 mark – and has not fizzled – shows that prices appear to be consolidating before the next move.

Finally, during the quarter former and current Presidents Trump and Biden secured enough delegates to clinch the nomination for their respective parties in the upcoming election later this year. While the election has heretofore been relegated to the back burner of investor interest, it should become a key component in future quarters as each candidate’s platform is firmed up, defined, and communicated to the public.

Q1 earnings season is rapidly approaching, and market’s current streak of gains will be highly dependent on those results. The ongoing rally is historic by the true definition of the word, as it is only the ninth time since 1940 that consecutive quarters have delivered back-to-back double-digit gains. Historically, this is a bullish signal and, against the goldilocks backdrop described above, the path to higher returns from here seems clear. However, it is likely that the remainder of the year will be increasingly challenging as the election unfolds and inflation levels bob and weave. Discipline and a sound long-term plan remain critical.

As ever, we thank you for your continued trust and support. Happy spring to all.

All indices are unmanaged, and investors cannot actually invest directly into an index. Unlike investments, indices do not incur management fees, charges, or expenses. Past performance does not guarantee future results.

A Tale of Two Years: ’23 In Review and ’24 In Prediction

February 13, 2024

Posted by Jason Edinger on Friday, January 5, 2024

In Review:

Following a tumultuous and disappointing 2022, we faced a fork in the road in terms of what would lie ahead in 2023: a recovery and rally to claw back some or all the previous year’s losses or a continuation of the pain and tough times. It was a deciding moment and may we all be thankful for the road not taken. The market GPS guided in the right direction, and 2023 ended up being a surprisingly strong year for both stock and bond markets.

Despite widespread predictions for a follow-through of the 2022 bear market and an all-but-assured recession, equity performance was impressive. The NASDAQ 100 turned in its best year since 1999 (+55%) while the most widely quoted market index, the S&P500, had an admirable +26.3% year. The Dow Jones underperformed slightly, while small caps enjoyed a furious rally over the final nine weeks of 2023 to conclude the year with a +24.3% mark. All told, equity markets finished 2023 on a high note and on the brink of brand-new all-time highs. It was a good year, and we will take it.

While stocks did most of the heavy lifting, bonds also delivered impressive returns throughout the year. Much attention was paid to the benchmark 10-year Treasury yield, which round-tripped the year to end unchanged after falling as low as 3.3% before ripping up to 5%. All told, the total return on the 10-year note was close to 4% and the aggregate bond index delivered 5.65% of total return in 2023. These returns were achieved despite the Federal Reserve raising interest rates four times throughout the year, capping a 2022 campaign which saw a cumulative 5.25% of aggregate rate increases.

The economy proved exceptionally resilient in 2023. A banking crisis in March resulted in the second largest bank failure in US history, with regional banks selling off nearly 30% in just three trading days. Although steadily decreasing, inflation remained high and the Fed seemed intent on hiking the economy into a recession. Nevertheless, a slew of fiscal and liquidity support was introduced to combat the drag from balance sheet unwinding, an inverted yield curve, and inflation. The labor market was robust throughout the year, as the unemployment rate is holding near generational lows as it appears increasingly likely that the Fed will achieve its highly coveted soft landing. From an economic standpoint, 2023 will be remembered for the recession that never materialized.

In Prediction:

Looking forward, the stage appears set for a continuation of the positive trends that played out in 2023. The economy, far from slowing down or contracting as many economists were convinced would happen, remains robust especially in the areas of job growth, consumer spending, and GDP. The so-called Goldilocks economy – not too soft, not too cold – is likely to set in and act as a foundation for full employment, economic stability, and continuously declining inflation. Against this backdrop, the economy can offer just enough support for financial markets to do well, without the threat of overheating and further potential rate hikes.

Inflation and interest rates will remain important going into the new year, but all signs point to a leveling out (finally). We have seen inflation cool steadily over recent months, largely a result of declining prices for food, energy, and commodities. However, services inflation and shelter (e.g., rent and housing costs) remain high and often operate on a lag, which could support price levels into 2024. In this case, it would be unlikely that the Fed would enact four interest rate cuts during the year as the markets currently predict. While one or two cuts may be in the offing, interest rates are likely to remain elevated as the Fed continues to try and pull inflation down to its 2% target rate.

From political and geopolitical standpoints, we are entering an election year which as always will include its share of fireworks and theatrics. But it is unlikely that the runup to the November vote will influence the financial markets to a large degree. Neither party wants a government shutdown, and even some of the most obstructionist politicians have shown signs of bipartisanship in recent months. More important than the election are policy risks, which include the deficit, debt, taxation and government spending. Any unforeseen developments in these key arenas could reset growth and economic expectations for the new year. Similarly, from a geopolitical view, the takeaway is that we need to be aware of the inherent risks (Ukraine war, Israel-Hamas war, China financial crisis), but markets do a very good job of pricing in such risk and can even rise in the face of them.

As we begin anew, we note that the S&P500 closed out 2023 with nine straight weekly gains, the longest streak since 1985. Ironically, 2023 was also the first year since 2012 that the bellwether index did not register a new all-time high during the period. With the Fed hiking cycle likely behind us, the broad indices are within striking distances of all-time highs. Upside momentum has been broadening in recent weeks, with increased participation, which could be yet another good sign for sustained market performance.

Thank you for your confidence and continued support. Happy New Year, and all the best for 2024.

Pieces of the Pie: Asset Allocation 101

February 5, 2024

Asset allocation. An idiom as conventional to the investment management industry as “block and tackle” is to sports and “keep it simple” is to management consulting. And for good reason. Nearly always, asset allocation is the first crucial step taken in the portfolio construction process. As a result, its importance is broadly accepted and agreed upon – serving as the cornerstone of portfolio construction while simultaneously being the key determinant of overall risk and return. Important stuff, indeed.

At its core, asset allocation is a “big picture” exercise – it examines an investment portfolio in the aggregate to determine which asset classes should be included in the portfolio and in what amounts. What the proper mix of assets should be. Examples of common asset classes included in allocation portfolios include equities, fixed income, cash, and alternative investments. The type and amount of each respective asset class to include is driven primarily by the relationship between long-term capital market assumptions and the investor’s investment objectives, constraints, and overall financial situation. Dividing one’s investment exposure across a variety of complementary and opposing asset classes ensures that the portfolio is well-diversified and not unduly exposed to a single type of idiosyncratic asset class risk.

Rather than choosing just a single asset class in which to invest – say equities for example – asset allocation supporters argue for allocating pieces of the pie to several asset classes to achieve a higher risk-adjusted return over a longer period. The idea underpinning this theory is that, by combining various asset classes that are not perfectly correlated with one another – e.g. they move independently of each other – overall portfolio risk is reduced and therefore aggregate return, after adjusting for risk, is enhanced. A similar and often interchangeable term for this dynamic is diversification.

Over time, diversification works and has proven to be a sensible strategy. During the 15 years ending in December 2022, investors have been challenged by a multitude of unexpected and intimidating issues. From natural disasters to geopolitical conflicts to a global pandemic and two major market selloffs, the last 15 years have been a volatile and tumultuous ride for investors. While the individual returns for stocks, bonds and cash were decidedly mixed during that time period, an asset allocation portfolio of stocks, bonds and other assets held together returned approximately 6% per year, and around 150% on a cumulative basis (source: JPMorgan Asset Management).

The below graphic, brought up to date through July 31st, 2023, depicts a standard asset allocation portfolio in the white box connected with black lines. As one can see, the allocation portfolio typically lands somewhere in the middle of the pack relative to all other asset classes for any calendar year. Never the best, yet never the worst. Never the hottest, but never ice cold. This is by design, and the result over a long time horizon is a smoother, less volatile, and more comfortable ride for investors than they would realize by simply picking one or two asset classes to invest in isolation.

Quilt
 

The returns for an asset allocation portfolio would naturally change depending on the mix of assets selected, the relative sizes of the assets within the portfolio, and the time period under measurement. At all times, a portfolio constructed with asset allocation as its foundation will have different parts of the portfolio performing differently during diverse underlying market environments. That is the entire point. Some asset classes will be “working” while others might not be. And while there is no perfect position or allocation that applies universally to all investors, and in some cases the asset allocation model may be out of favor relative to other philosophies, we can conclude that asset allocation is one of the most important elements of a sound investment plan.

It allows investors to prepare for a wide range of outcomes without having to lean into a crystal ball to predict the future or engage in the folly of market timing. By building a portfolio that encompasses a wide selection of securities and a broad range of asset classes and investment styles, the investor can help protect the portfolio from sudden changes in the financial markets. Additional benefits that can potentially be realized through this approach include reduced risk via lower volatility, opportunities for more consistent returns as the impact of poorly performing asset classes is lessened, and a greater focus on long-term goals as the need to constantly adjust positions or chase trends is minimized.

There is no doubt that asset allocation is a key factor in determining portfolio risk and return over time – in some cases accounting for 90% or more of portfolio performance. As there may be considerable value to be realized in focusing on the right mix of asset classes, rather than relying on stock picking or market timing as the primary driver of portfolio returns, it is worth returning to asset allocation principles early and often in the portfolio management process.

Asset allocation and diversification does not assure a profit or protect against loss in declining markets, and they cannot guarantee that any objective or goal will be achieved.

New Year Energy

Posted by Jason Edinger on Monday, February 5, 2024

After a strong rally to conclude 2023, the new year rang in with a more cautious tone as small caps slid and large caps led. Stocks have now rallied for the third straight month, marking the longest streak since August 2021. Unlike the last two months, which saw positive returns for both stocks and bonds, this January provided performance dispersion across asset classes, as treasuries experienced weakness with interest rate cuts taking center stage. Small caps also struggled, lagging their large cap brethren and losing nearly 4% of value during the month. Still, strength was seen across the broad indices, with the S&P500 notching a gain of 1.7% and large cap growth names gaining 2.5%. Party on, Wayne.

Mega-cap tech names, to include the vaunted “Magnificent 7,” continued to drive positive performance. Microsoft, a card-carrying member of the Mag7, eclipsed the $3T market capitalization level just as the NASDAQ and S&P500 were making new all-time highs[1]. Despite weakness to begin the month, the overall market direction was higher as the soft-landing scenario was supported by stronger than expected GDP and retail sales numbers which show consumers continuing to defy expectations and spend, spend, spend. This backdrop should support ongoing strength for equities as we move into February.

The treasury yield curve steepened during the month, resulting in modest weakness in the fixed income space. The 10Y treasury yield was essentially flat, but 30Y yields rose as high as 4.4% before pulling back slightly. Broadly speaking, treasury yields behaved as expected after the Federal Reserve left rates unchanged at its January meeting. While the central bank left some options open, it threw cold water on the possibility of a March rate cut, expressing caution about such cuts until there’s more confidence that inflation is moving sustainably toward that magic 2% number. As of this writing, the target rate remains in the 5.25-5.5% range and futures markets are pricing in just a 35% of a March cut. Not great odds for treasury bulls.

Meanwhile, in the “real economy,” both hard and soft data continue to come in strong. The preliminary reading of Q423 GDP was 3.3% annualized, reflecting healthy vigor in the overall economy. The GDP number was driven primarily by personal consumption (contributing 1.9%) and government spending (contributing 0.6%). For the full year, GDP grew by 2.5%, well exceeding expectations. At the same time, the labor market added 3.5M jobs for the full year, resulting in a generationally low unemployment rate of 3.7%. Strong to quite strong.

The one outlier in this slew of bullish data was inflation. The year-over-year pace of inflation ramped up again in December but remains solidly in the 3-4% range that we have observed since May of last year. The reluctantly strong shelter index contributed the most to higher prices, even while core CPI (which strips out select items such as food and energy) eased down to a 3.9% annual pace. Subsequent reports reinforced flat core prices.

Lastly, we did see geopolitical risk increase during the month, as attacks against shipping in the Red Sea by the Houthis are having a dramatic impact on logistics. The implications for global trade and supply chains could be devastating, especially for select areas already reeling from several wars and drought conditions in places like the Panama Canal. Oil prices, as we would presume, rose during January to log their first gain in four months. And while geopolitical factors have failed to materially affect the capital markets in recent years, they remain a wildcard and could easily escalate, along with domestic political uncertainty as the US presidential campaign gears up.

All indices are unmanaged, and investors cannot actually invest directly into an index. Unlike investments, indices do not incur management fees, charges, or expenses. Past performance does not guarantee future results.

[1] Microsoft is now bigger than Apple, and Amazon is now bigger than Google